WHAT WE DO FOR YOU
Groundswell specializes in designing, implementing and supporting data integration, business intelligence, and predictive analytics. Our deep expertise allows us to deliver complex projects to managed and predictable outcomes. We have strong, long-standing partnerships with premier Information Management software vendors.

CAREERS
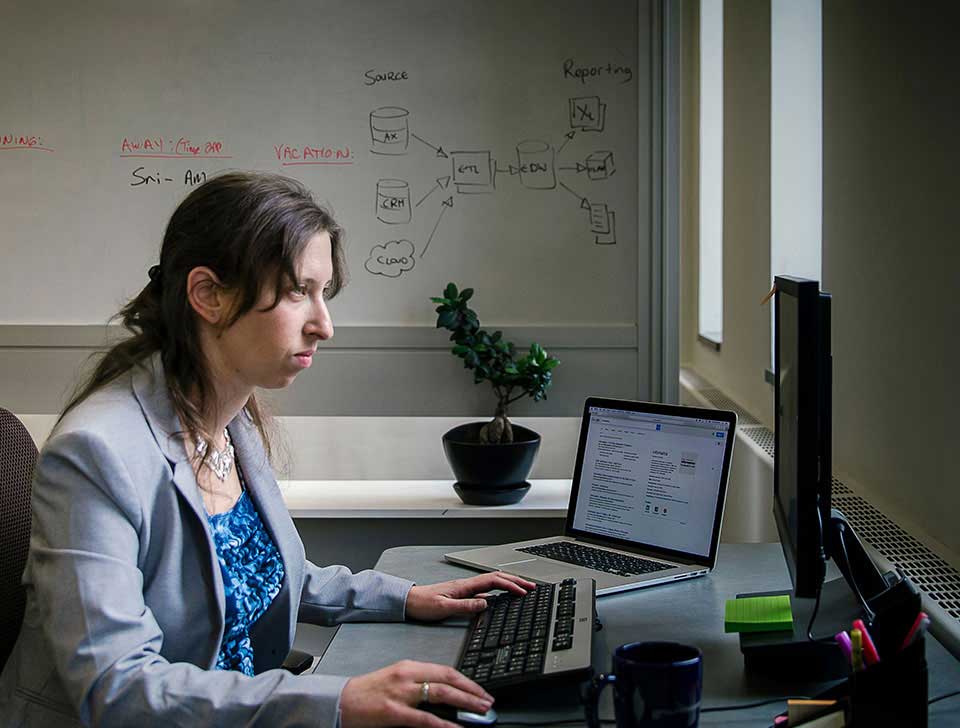
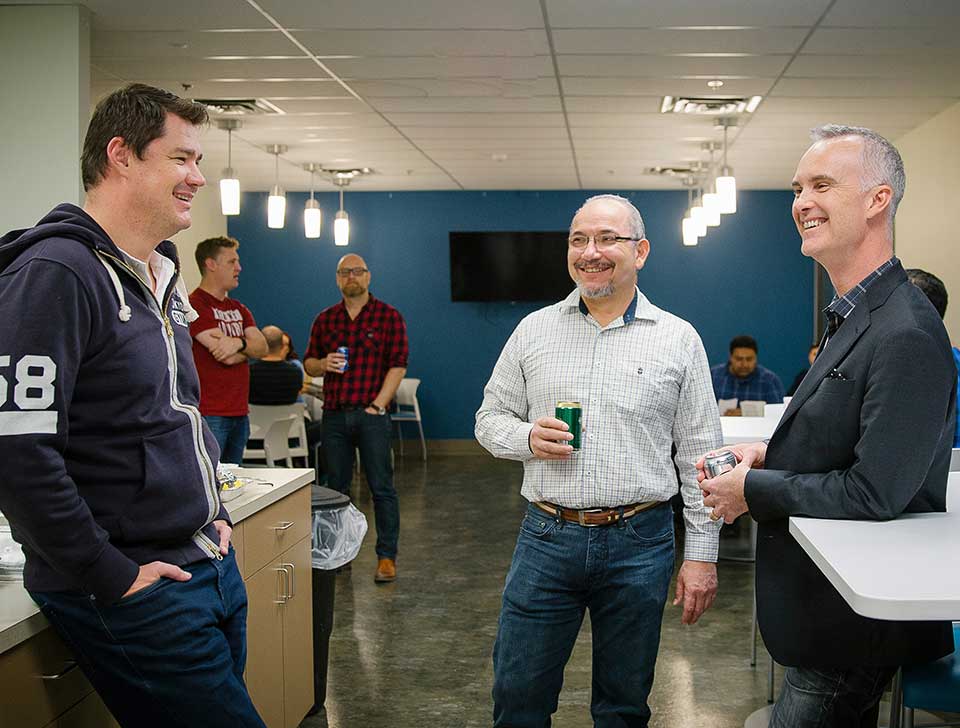
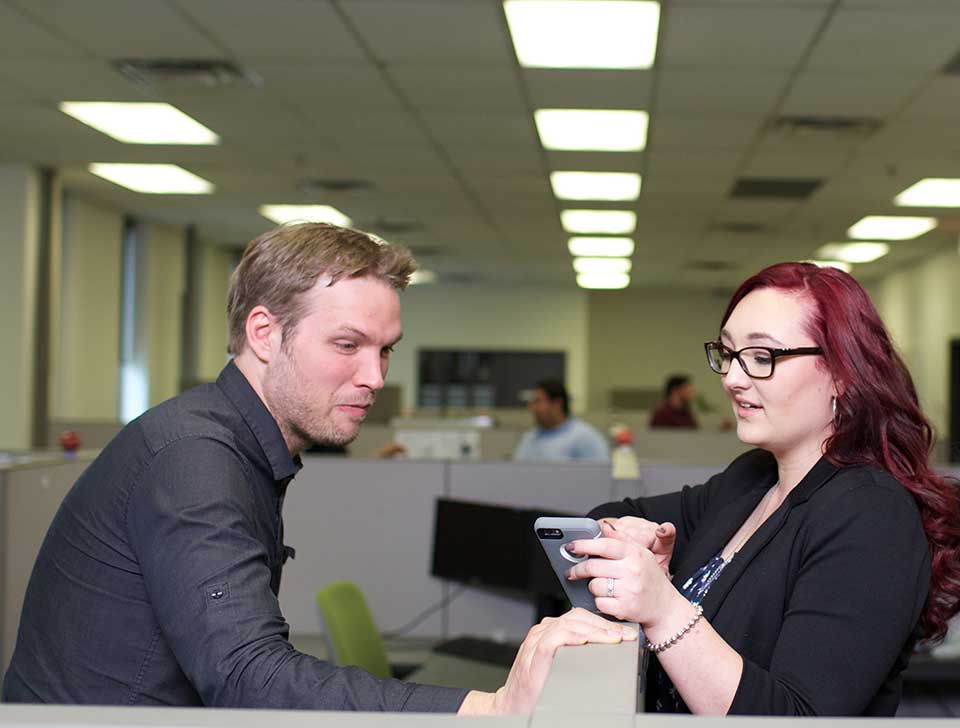
Groundswell provides a culturally diverse and supportive work environment, with access to leading edge technologies, career-enhancing training, and the opportunity to work with some of the biggest and most innovative corporations in Western Canada.
BLOGS & ARTICLES
Technical briefings and Information Management insights.
NEWS & EVENTS
All the latest news and events from Groundswell, our partners, and the IT industry.
CASE STUDIES
Showcasing some of our success stories.

Calgary Head Office
214 11 Avenue S.W.
Suite 200
Calgary AB T2R 0K1
Phone: 403.262.2041
Email: [email protected]

Edmonton Office
Scotia Place, 10060 Jasper Avenue
Suite 2020
Edmonton, Alberta T5J 3R8
Phone: 780.970.0253
Email: [email protected]

Vancouver Office
535 Thurlow Street
Suite 601
Vancouver BC V6E3L2
Phone: 604.563.4557
Email: [email protected]

Seattle Office
11808 Northup Way, Suite 240
Bellevue WA 98005
Phone: 1.877.245.6072
Email: [email protected]